Estimating distribution area in six Argia damselflies (Insecta: Odonata: Coenagrionidae) including A. garrisoni, a threatened species
Laura Rangel-Sánchez a, Angela Nava-Bolaños b, *, Fredy Palacino-Rodríguez a, c, Alex Córdoba-Aguilar b,
a Grupo de Investigación en Odonatos de Colombia-Grupo de Investigación en Biología, Departamento de Biología, Universidad El Bosque, Av. Cra 9 No. 131A-02 Bogotá, Colombia
b Departamento de Ecología Evolutiva, Instituto de Ecología, Universidad Nacional Autónoma de México, Apartado postal 70-275, Circuito Exterior, Ciudad Universitaria, 04510 Coyoacán, México City, Mexico
c Centro de Investigación en Acarología, Calle 152B # 55-45, Bogotá, Colombia
* Corresponding author: anb@ciencias.unam.mx (A. Nava-Bolaños)
Abstract
Damselflies and dragonflies (Insecta: Odonata) are currently facing a number of threats. One tool to provide a straightforward assessment of risk is distribution area. Here we have used ecological niche modeling to estimate distribution range for 6 species of Argia damselflies distributed in North America: A. cuprea, A. funcki, A. garrisoni, A. harknessi, A. munda, and A. rhoadsi. These species are not included in the International Union for the Conservation of Nature (IUCN) Red List, except for A. garrisoni which has been categorized as Least Concern. Our results indicated large distribution areas for all species, except for A. garrisoni, (8,038 km2 after a refinement analysis looking for suitable habitat). Large distribution can be explained by similar niche properties shared by all study species. This is not the case for A. garrisoni whose situation seems worrying. This species was found in the Mexican state of San Luis Potosí in 1999 and there have been no further observations so it deserves further inspection to see whether populations are at risk. In the meantime, and according to the IUCN criteria, A. garrisoni should be placed under a vulnerable category.
Keywords:
Distribution range; Ecological niche modeling; Damselflies; IUCN
© 2018 Universidad Nacional Autónoma de México, Instituto de Biología. Este es un artículo Open Access bajo la licencia CC BY-NC-ND
Estimando el área de distribución de seis caballitos del diablo del género Argia (Insecta: Odonata: Coenagrionidae) incluyendo A. garrisoni, una especie amenazada
Resumen
Los caballitos del diablo y las libélulas (Insecta: Odonata) enfrentan varias amenazas. Una herramienta para evaluar riesgo, es el área de distribución. Usamos el modelado de nicho ecológico para estimar el rango de distribución de 6 especies de caballitos del diablo del género Argia, en Norte América: A. cuprea, A. funcki, A. garrisoni, A. harknessi, A. munda y A. rhoadsi. Estas especies no están incluidas en la Lista Roja de la Unión Internacional para la Conservación de la Naturaleza (UICN), excepto A. garrisoni que se categorizó como de preocupación menor (“least concern”). Nuestros resultados indicaron distribuciones amplias para todas las especies, excepto A. garrisoni (8,038 km2 después de un análisis refinado de hábitat disponible). Una distribución amplia puede explicarse por propiedades de nicho similares en todas las especies. Este no es el caso para A. garrisoni cuya situación es preocupante. Esta especie se encontró en el estado mexicano de San Luis Potosí en 1999 y no se ha recolectado desde entonces por lo que debería buscarse para saber si sus poblaciones están en riesgo. Mientras tanto, y de acuerdo a los criterios de la UICN, A. garrisoni debería ser incluida en la categoría de vulnerable.
Palabras clave:
Rango de distribución; Modelado de nicho ecológico; Caballitos del diablo; UICN
Introduction
The biodiversity crisis that has been documented in detail for several taxa (Dirzo et al., 2014), includes insects of the order Odonata (dragonflies and damselflies) with 1 in 10 odonate species being threatened (Clausnitzer et al., 2009). This despite their fairly high dispersal ability and flexibility to occupy different habitats (Stoks & Córdoba-Aguilar, 2012). Similar to other aquatic insects, deforestation and susceptibility of anthropogenic change for their freshwater habitats (especially lentic waters; Clausnitzer et al., 2009) seem major drivers underlying threat (Dijsktra et al., 2014).
Argia damselflies are a highly speciose genus with up to 144 species (Caesar & Wenzel, 2009; Garrison, 1994), with a large occurrence throughout the American continent. Some generalities of their ecology are that they use both lentic and lotic freshwaters, and occur in different habitats that comprise tropical and non-tropical areas (Garrison, 1994). Argia species are mostly small-sized odonates with males of some species being either territorial (Guillermo-Ferreira & Del Claro, 2012) or nonterritorial (Sánchez-Guillén et al., 2014). The International Union for Conservation of Nature (from now on, IUCN) has incorporated 36 species of Argia in the Red List, of which only A. sabino appears threatened (“vulnerable” category; IUCN, 2017). This reduced number implies that further efforts are badly needed to uncover more Argia species. One criteria to be included as part of IUCN assessment is the extent of occurrence (criterion B; IUCN, 2017) which can be gathered using ecological niche models (Guisan & Zimmermann, 2000; Gouveia et al., 2011).
With the aim of providing biological information of odonates that have not been included in the IUCN Red List, in this work we have assessed the distribution area of 6 Argia species: Argia cuprea (Hagen, 1861), A. funcki (Selys, 1854), A. garrisoni Daigle, 1991, A. harknessi Calvert, 1899, A. munda Calvert, 1902, and A. rhoadsi Calvert, 1902. Except for A. garrisoni which appears as least concern (IUCN, 2017), the remaining 5 species have not been assessed.
Materials and methods
Presences of the 6 Argia species were compiled from literature records, confirmed records in OdonataCentral (http://www.odonatacentral.org), Conabio records (www.conabio.gob.mx), GBIF records (www.gbif.org), and published papers, thesis and data provided by experts in odonates. All data were checked carefully for geographic accuracy which, when in doubt, included asking specialists (e.g., Rosser Garrison). Notice that most records were gathered from OdonataCentral, which is a repository of odonate record information. We are confident that the biases of identification should be minimal because these data were provided by experts for these animals. Still, we limited our analyses to the 6 species indicated above as these were the ones we were fully confident in regards to the quality of their records.
Distribution models were built only for species with more than 30 localities. Thus, the final data set included 1585 unique presences of the 6 species, which were predominantly adult specimens: 759 records for A. cuprea, 261 for A. funcki, 255 for A. garrisoni, 185 for A. harknessi, 86 for A. munda and 39 for A. rhoadsi. Although these records spanned the last 40 years, most came from the last 15 years. The database is available upon request.
We used the WorldClim 1.4 (www.worldclim.org) data set (Hijmans et al., 2005) at 0.041666669 degrees (or 5 km) of resolution to set predicting bioclimatic variables for our models. To establish a set of uncorrelated climatic variables, we intersected the variables with target group points, and with 10,000 points randomly selected in the extension of the study area (M). We eliminated some variables with an exploratory data analysis of contribution of variables using jackknife and Pearson correlation analyses (i.e., any value > 0.7). Thus, we selected variables with low correlation and high contribution to reduce the parametrization of the models. After this, the final data set included uncorrelated variables which had more biological importance for Argia species, and more contribution according to the jackknife analysis. Such variables were: mean diurnal temperature range (bio 02), temperature seasonality (bio 04), mean temperature of warmest quarter (bio 10), precipitation of wettest month (bio 13), precipitation of driest month (bio 14), and precipitation seasonality (bio 15). Our study area included North America where our study species occur.
Our study area was North and Central America where members of the genus Argia occur (Caesar & Wenzel, 2009; Garrison, 1994), covering land between the latitudes 53.00 to 0.00N, and the longitudes -130.00 to -55.00W. To choose the best background, preliminary species distribution models were generated with Maxent 3.3.3k (Phillips et al., 2006) with target group points, 10,000 points randomly selected in the extension of the study area (M), and with special extent delineating M for each particular species with ecoregions (World Wildlife Fund; www.worldwildlife.org/) for North America, and biogeographical provinces (Conabio) for Mexico. Models were constructed setting several parameters to default (‘Auto features’, convergence = 10-5, maximum number of iterations = 500). However, we used random seed (with a 30 test percentage), 10 replicates, removed duplicate records, ran bootstrap replicated type, with no extrapolation and no clamping. All this to find which combination of settings and variables generated the best outcomes (highest area under the curve, or AUC) while minimizing the number of model parameters, as well as producing ‘closed’, bell-shaped response curves guaranteeing model calibration and transferability (Elith et al., 2010). The best background was 10,000 points randomly selected in the extension of the study area.
Final models were built with Biomod (Biodiversity Modelling) package in R software. This package is a platform for predicting species’ distribution, including the ability to model the distribution using various techniques and test patterns (Thuiller et al., 2009). When using Biomod, we trained models using 4 widely used algorithms: maximum entropy (Maxent), random forest (RF), generalized boosting methods (GBM) and multivariate adaptive regression splines (MARS). These models have shown good performance in terms of predictive power (Broennimann et al., 2012; Pliscoff & Fuentes-Castillo, 2011; Reiss et al., 2011). From individual models obtained with these different algorithms, we generated a “consensus model”. Such model combination is the best logistic compromise to avoid either overfitting and overpredicting (Merow et al., 2014). In other words, this reduces biases and limitations of using only individual models. 70% of data was used for training, and 30% for validation with 10 replicates. The final validation of models was performed with TSS (True Skills Statistics), average net rate of successful prediction for sites of presence and absence (Liu et al., 2009), ranging from -1 to 1, where the more positive values indicate a higher degree of accuracy and discrimination model (Allouche et al., 2006) (Table 1). It is noteworthy that the result of these models is not the area that species occupies absolutely, because these models do not consider population dynamics, dispersibility, interactions with other species and human impacts. However, these models can make right transferences where species can be potentially found given their environmental conditions. This is based on the assumption that the distribution known of species provides enough information to characterize its environmental requirements.
A total of 420 models were generated, whose performance was assessed by means of the AUC and TSS statistic, while minimizing the number of model parameters. The best presence/absence models using the “10 percentile training presence” are presented. This threshold was used because we prefer to err on the side of caution accepting that a 10% of our presences could be problematic (for a similar rationale, see Sánchez-Guillén et al., 2013). The best models of current climatic conditions of species were used to generate projections into the geography.
Results
Our results indicated that A. garrisoni showed a distribution area of less than 20,000 km² (see below). Since a distribution area smaller than 20,000 km² is one of those criteria that allows categorizing whether any species may be threatened (IUCN, 2017), we took a step further to characterize the habitat of this species for any field assessment and/or future protection effort (for a similar approach, see Cuevas-Yáñez et al., 2015). For this characterization, all types of land use corresponding to the habitat of the species were selected and trimmed using both the soil cover layer and the vegetation cover of the Instituto Nacional de Estadística y Geografía (Inegi) (Union of Layers, Series V: Inegi, 2011), removing, for example, urbanized or arid zones that do not correspond to A. garrisoni’s habitat, rendering a “clean” layer with this selection. From the overlap of this layer on the distribution map of the species obtained in the Biomod package, a reduced distribution area was provided compared to the initial distribution, but more adjusted to the actual location of the species. The map shown in the results is the one obtained after making the land use cut-off corresponding to the habitat for this species. We finally obtained the area in km² by calculating the number of cells to a size of 0.041666669, with ArcMap® software.
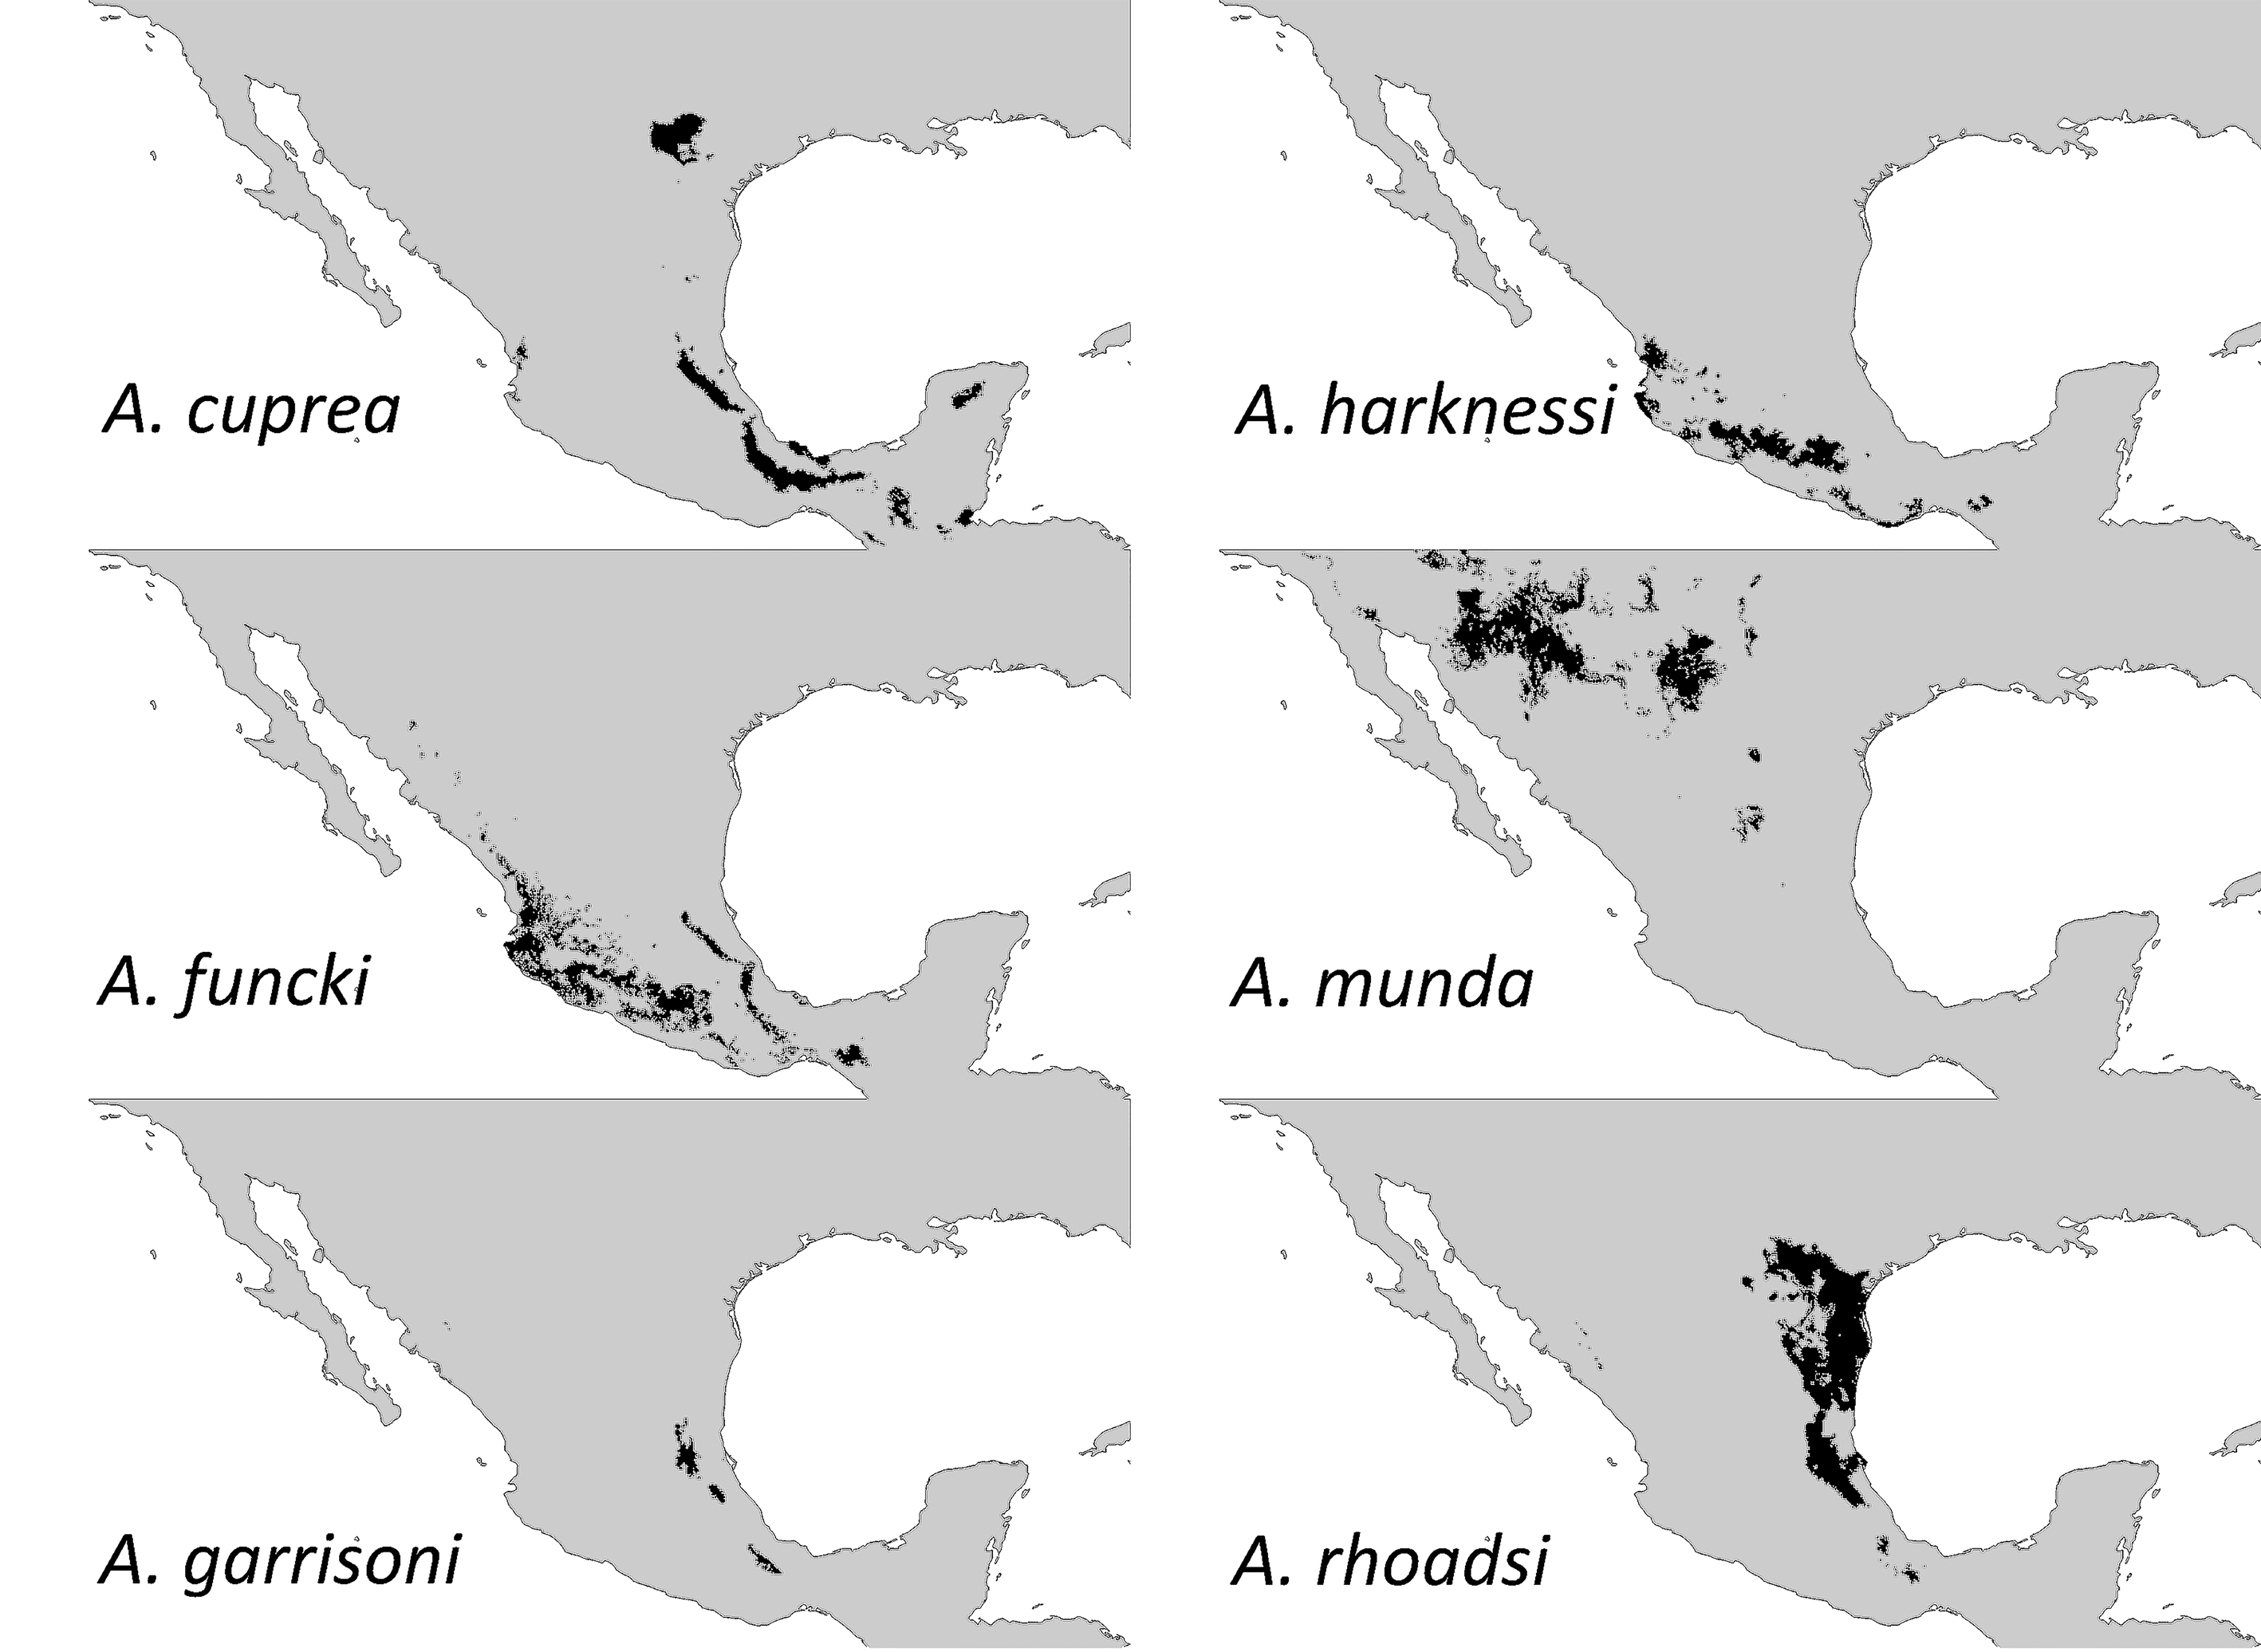
Ecological niche models predicted a considerably large distribution for all species except for A. garrisoni which had 9,991 km2 (Fig. 1; Table 1). Our trimming exercise to predict a more suitable habitat for this species, rendered a more reduced area of 8,038 km2
Discussion
Five out of 6 Argia species that we modelled here showed fairly large distribution areas (over 70,000 km2). This large area estimates for these 5 species coincides with those gathered for other Argia species such as A. anceps, A. extranea, A. oenea, and A. tezpi that mainly occur in central Mexico (Nava-Bolaños et al., 2017). It seems that the niche properties of the entire genus are highly conserved as assessed by their large degree of area overlapping (i.e., sympatry; Nava-Bolaños et al., 2017). Such similar niche properties imply frequent copulations with heterospecifics. This is the case of A. rhoadsi and A. munda which are found mainly in northeastern Mexico and whose distribution extends from the southern part of Texas to the lower part of San Luis Potosí (Dunkle, 2004), inhabiting lagoons, streams and riversides (Abbott, 2001). Both species can be frequently found in heterospecific matings (A. Córdoba-Aguilar, unpub. obs.). As a matter of fact, possibly the radiation of the entire genus may not necessarily be related to their ecological pressures but to sexual selection forces as has been proposed for other damselflies (Wellenreuther & Sánchez-Guillén, 2016). This non-adaptive radiation may render species not to be habitat-specific. Perhaps the exceptions are those species that are at risk such as A. sabino (IUCN, 2017) and A. garrisoni.
|
Table 1 Estimates of distribution areas (in km²) for 6 species of the genus Argia according to ecological niche models (ENM) and their TSS values. |
||
|
Species |
ENM area (km²) |
TSS value |
|
Argia cuprea |
113,725 |
0.905 |
|
Argia funcki |
130,143 |
0.853 |
|
Argia garrisoni |
9,991 |
0.845 |
|
Argia harknessi |
73,428 |
0.886 |
|
Argia munda |
161,815 |
0.893 |
|
Argia rhoadsi |
194,479 |
0.892 |
Our results can be used to fulfill current IUCN Red List knowledge. As indicated before, no risk assessment has been carried out for A. cuprea, A. funcki, A. harknessi, A. munda and A. rhoadsi. Given the large area of occurrence estimation, these 5 species should be placed in a low risk category by not meeting the criteria of a reduced extension of occurrence. However, this is not the case of A. garrisoni, which is an endemic species from Mexico (González-Soriano & Novelo-Gutiérrez, 2014). Despite the reduced distribution estimated by our methodology, this species was abundant in the Mexican state of San Luis Potosí in 1999, in the roots of citrus along rivers and perched in banks of partially dry sludge (R. Garrison pers. comm.). Ecological niche models suggested that this species would occur in the following biogeographic provinces: Sierra Madre Oriental, Oaxaca, and Gulf of México (Conabio, 1997). However, since 1999 there have been no more recent records for this species. According to the IUCN criteria, the fulfillment of even a single criterion, in this case the B1, allows the change from least concern to vulnerable which is when an area of less than 20,000 km² is estimated (IUCN, 2017). Even when one may see such criteria as too vague, restricted distribution areas correlate well with the probability of extinction in odonates (the smaller the area, the more likely that a species will disappear; Korkeamäki & Suhonen, 2002), so our risk concerns for A. garrisoni are likely to be founded.
Acknowledgements
To Rosser Garrison for kindly providing location data and discussing occurrences. To Gerardo Rodríguez Tapia and Raúl I. Martínez Becerril for technical assistance. We also thank the Grupo de Investigación en Odonata de Colombia (GINOCO), Grupo de Investigación en Biología (GRIB), Biology Department at Universidad El Bosque, and the Centro de Investigación en Acarología for their academic support. Financial support came from PAPIIT grants IN203115 and IN206618.
References
Abbott, J. C. (2001). Distribution of dragonflies and damselflies (Odonata) in Texas. Transactions of the American Entomological Society, 127, 189–228.
Allouche, O., Tsoar, A., & Kadmon, R. (2006). Assessing the accuracy of species distribution models: prevalence, kappa and the true skills statistic (TSS). Journal of Applied Ecology, 43, 1223–1232.
Broennimann, O., Fitzpatrick, M. C., Pearman, P. B., Petitpierre, B., Pellissier, L., Yoccoz, N. G. et al. (2012). Measuring ecological niche overlap from occurrence and spatial environmental data. Global Ecology and Biogeography, 21, 481–497.
Caesar, R. M., & Wenzel, J. W. (2009). A phylogenetic test of classical species groups in Argia (Odonata: Coenagrionidae). Entomologica Americana, 115, 97–108.
Clausnitzer, V., Kalkman, V. J., Ram, M., Collen, B., Baillie, J. E., Bedjanič, M. et al. (2009). Odonata enter the biodiversity crisis debate: the first global assessment of an insect group. Biological Conservation, 142, 1864–1869.
Conabio (Comisión Nacional para el Estudio de la Biodiversidad). (1997). Provincias biogeográficas de México. Retrieved on March 1st, 2018from: http://conabio.gob.mx/informacion/metadata/gis/rbiog4mgw.xml?_xsl=/db/metadata/xsl/fgdc_html.xsl&_indent=no
Cuevas-Yáñez, K., Rivas, M., Muñoz, J., & Córdoba-Aguilar, A. (2015). Conservation status assessment of Paraphlebia damselflies in Mexico. Insect Conservation and Diversity, 8, 517–524.
Dijkstra, K. D. B., Monaghan, M. T., & Pauls, S. U. (2014). Freshwater biodiversity and aquatic insect diversification. Annual Review of Entomology, 59, 143–163.
Dirzo, R., Young, H. S., Galetti, M., Ceballos, G., Isaac, N. J., & Collen, B. (2014). Defaunation in the anthropocene. Science, 345, 401–406.
Dunkle, S. W. (2004). Critical species of Odonata in North America. International Journal of Odonatology, 7, 149–162.
Elith, J., Michael, K., & Steven, P. (2010). The art of modelling range-shifting species. Methods in Ecology and Evolution, 1, 330–342.
Garrison, R.W. (1994). A synopsis of the genus Argia of the United States with keys and descriptions of new species, Argia sabino, A. leonorae, and A. pima (Odonata: Coenagrionidae). Transactions of the American Entomological Society, 120, 287–368.
González-Soriano, E., & Novelo-Gutiérrez, R. (2014). Biodiversidad de Odonata en México. Revista Mexicana de Biodiversidad, 85, S243–S251.
Gouveia, C., Liberato, M. L. R., DaCamara, C. C., Trigo, R., & Ramos, A. M. (2011). Modelling past and future wine production in the Portuguese Douro Valley. Climate Research, 48, 349–362.
Guillermo-Ferreira, R. & Del Claro, K. (2012). Territoriality and male-biased sexual size dimorphism in Argia reclusa (Odonata: Zygoptera). Acta Ethologica, 15, 101–105.
Guisan, A., & Zimmermann, N. E. (2000). Predictive habitat distribution models in ecology. Ecological Modelling, 135, 147–186.
Hijmans, R., Cameron, S., Parra, J., Jones, P., & Jarvis, A. (2005). Very high resolution interpolated climate surfaces for global land areas. International Journal of Climatology, 25, 1965–1978.
Inegi (Instituto Nacional de Estadística y Geografía). (2011). Layer of soil use and vegetation. Retrieved on October 1st, 2016 from: http://www.inegi.org.mx/geo/contenidos/recnatusosuelo/
IUCN (International Union for the Conservation of Nature). (2017). Guidelines for using the IUCN Red List categories and criteria. Version 12. Retrieved on August 9th, 2016 from: http://www.uicnredlist.org/documents/RedlistGuidelines.pdf
Korkeamäki, E., & Suhonen, J. (2002). Distribution and habitat specialization of species affect local extinction in dragonfly Odonata populations. Ecography, 25, 459–465.
Liu, C., White, M., & Newell, G. (2009). Measuring the accuracy of species distribution models: a review. In R. S. Anderssen, R. D. Braddock, & L. T. H. Newham, (Eds.) 18th World IMACS Congress and MODSIM09 International Congress on Modelling and Simulation. Modelling and Simulation Society of Australia and New Zealand and International Association for Mathematics and Computers in Simulation. July 2009, Cairns, Australia.
Merow, C., Smith, M. J., Edwards, T. C., Guisan, A., McMahon, S. M., Normand, S. et al. (2014). What do we gain from simplicity versus complexity in species distribution models? Ecography, 37, 1267–1281.
Nava-Bolaños, A., Sánchez-Guillén, R. A., Munguía-Steyer, R., & Córdoba-Aguilar, A. (2017). Isolation barriers and genetic divergence in non-territorial Argia damselflies. Biological Journal of the Linnean Society, 120, 804–817.
Phillips, S. J., Anderson, R. P., & Schapire, R. E. (2006). Maximum entropy modeling of species geographic distributions. Ecological Modelling, 190, 231–259.
Pliscoff, P., & Fuentes-Castillo, T. (2011). Modelación de la distribución de especies y ecosistemas en el tiempo y en el espacio: una revisión de las nuevas herramientas y enfoques disponibles. Revista de Geografía Norte Grande, 48, 61–79.
Reiss, H., Cunze, S., König, K., Neumann, H., & Kröncke, I. (2011). Species distribution modelling of marine benthos: a North Sea case study. Marine Ecology Progress Series, 442, 71–86.
Sánchez-Guillén, R. A., Córdoba-Aguilar, A., Cordero-Rivera, A., & Wellenreuther, M. (2014). Rapid evolution of prezygotic barriers in non-territorial damselflies. Biological Journal of the Linnean Society, 113, 485–496.
Sánchez-Guillén, R. A., Muñoz, J., Rodríguez-Tapia, G., Arroyo, T. P. F., & Córdoba-Aguilar, A. (2013). Climate-induced range shifts and possible hybridisation consequences in insects. Plos One, 8, e80531.
Stoks, R., & Córdoba-Aguilar, A. (2012). Evolutionary ecology of Odonata: a complex life cycle perspective. Annual Review of Entomology, 57, 249–265.
Thuiller, W., Lafourcade, B., & Araujo, M. (2009). ModOperating manual for BIOMOD. In W. Thuiller & B. Lafourcade (2009) BIOMOD: species/climate modelling functions. R package version, 1-1. Available online at: http://www.r-forge.r-project.org/scm/viewvc.php/*checkout*/pkg/inst/doc/Biomod%20Manual.pdf?revision=67&root=biomod&pathrev=218
Wellenreuther, M., & Sánchez-Guillén, R. A. (2016). Nonadaptive radiation in damselflies. Evolutionary Applications, 9, 103–118.
